The wave that survived as a line
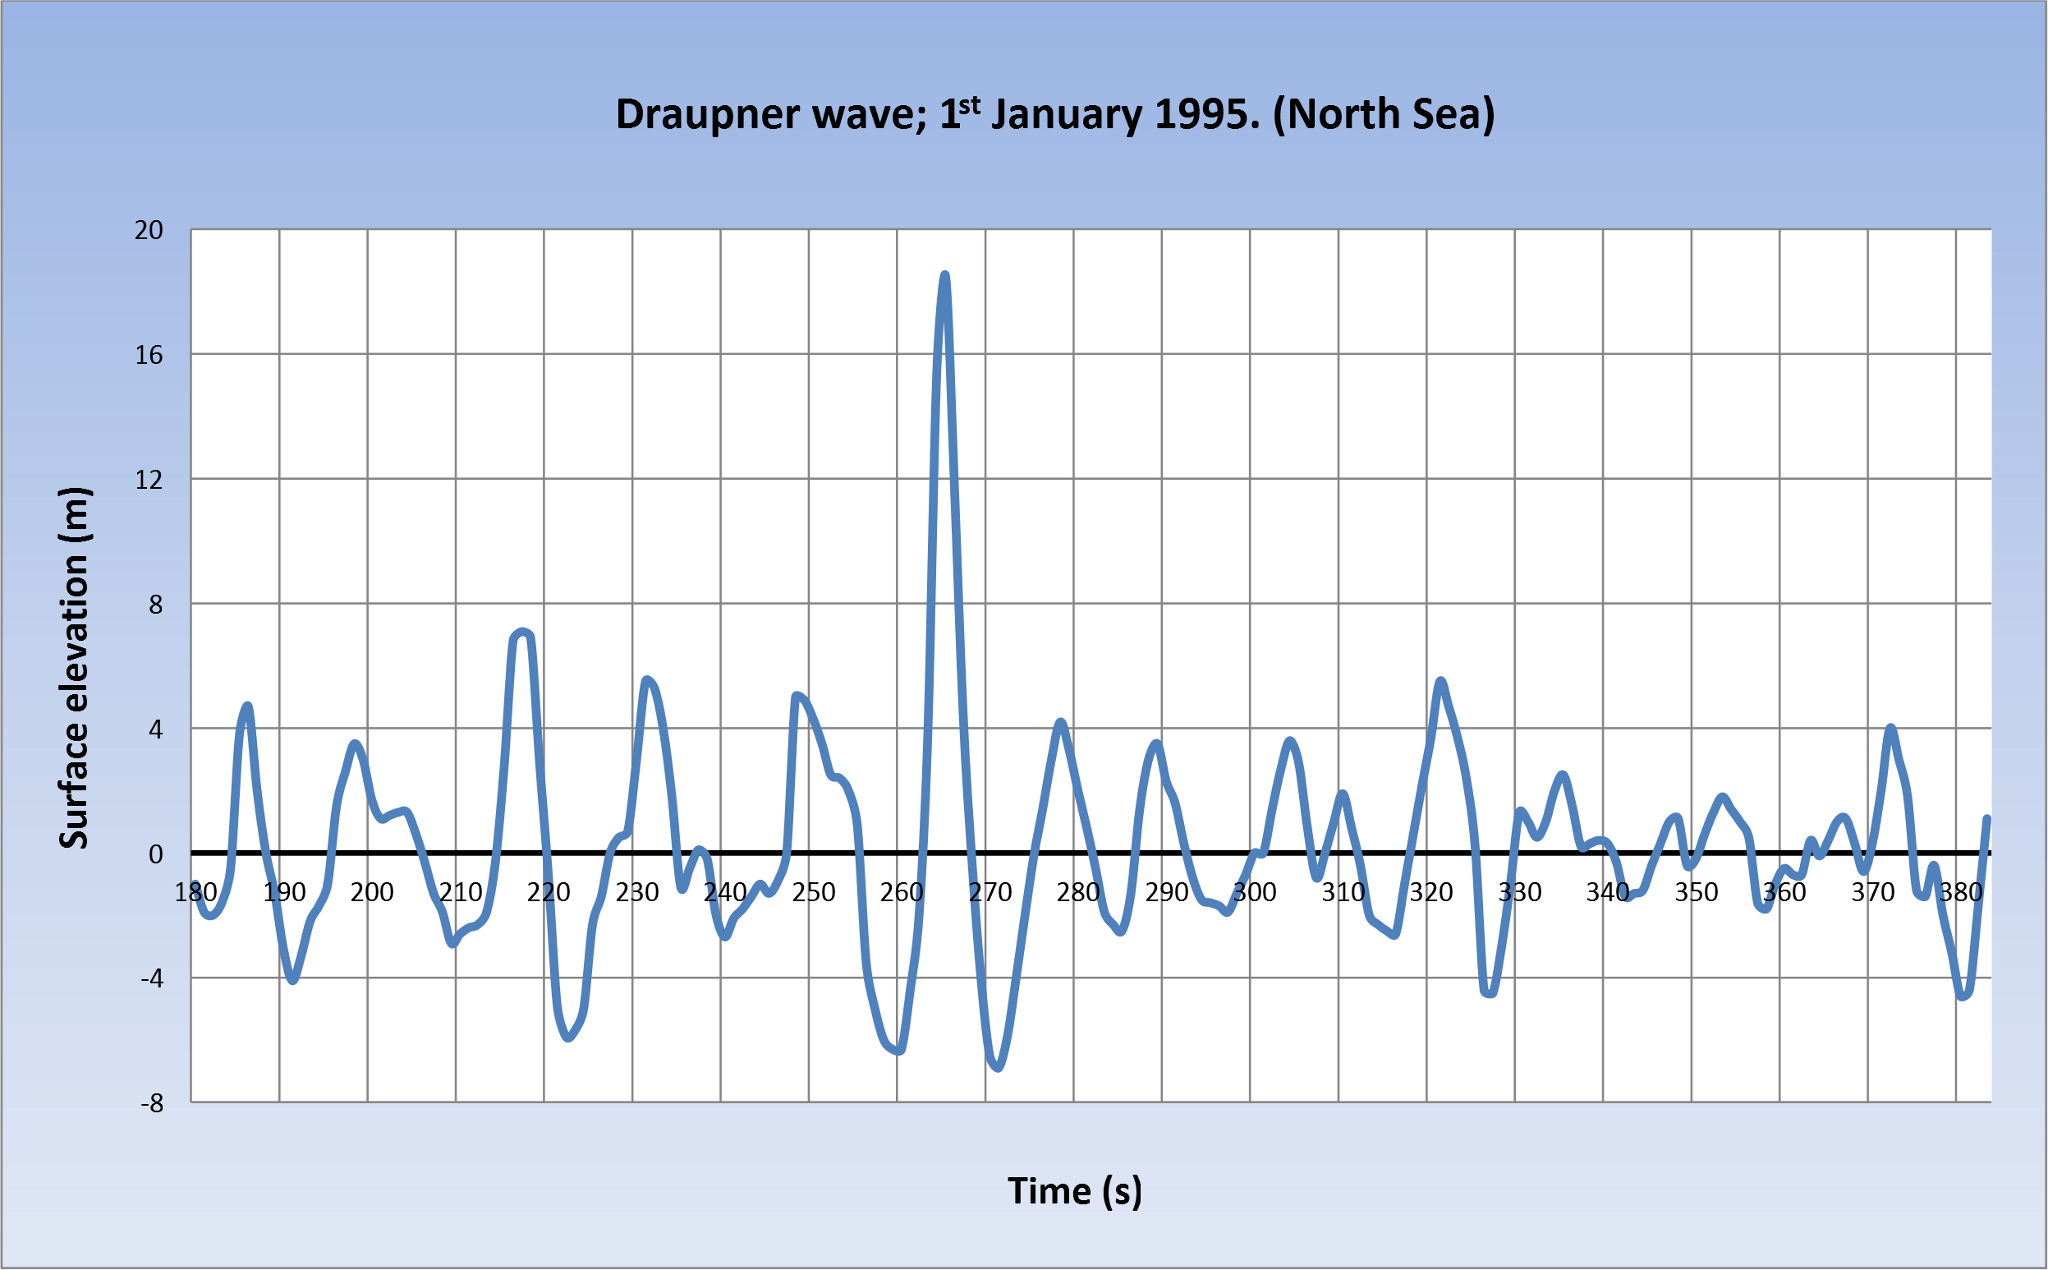 Crest: +18.5 m above mean sea levelThe adjacent trough makes the total wave 25.6 m highSurrounding significant wave height: almost 12 m
Authentic data visualisation by Ingvald Straume, based on the Draupner laser record. Display colours are inverted for this interface. CC BY-SA 3.0. The moving scan line and labels are Code Gaia interface elements, not part of the 1995 instrument output.
The storm was already severe. Waves around the Draupner platform were running at a significant height of almost twelve metres. That number does not describe every wave; it is the average height of the highest third. The sea was dangerous before anything unusual happened.
Then one crest climbed far outside the surrounding population. The laser measured the surface 18.5 metres above mean sea level. From the neighbouring trough to the top, the wave reached 25.6 metres.
More than twice the surrounding significant height
A rogue wave is defined by its relation to the sea around it, not by a universal minimum height. A ten-metre wave may qualify in moderate seas; a much taller wave may not qualify in an enormous storm. Draupner crossed the usual ratio threshold decisively.
That is why the event was not merely “a very large storm wave.” It was a statistical outlier recorded with enough detail to become a test case for models, laboratories and design assumptions.
The witness pointed downward
Draupner E was a new offshore structure linked to the older Draupner S platform, about 160 kilometres from Norway. Its instruments monitored wave elevation and structural response. The decisive sensor was not watching the horizon. It was mounted above the water and measured the changing distance to the surface below.
This matters because the surviving object is not a photograph of a wall of water. It is a time series: height against seconds. The famous central spike was checked against other platform observations and minor storm damage. The record was too coherent to dismiss as one bad number.
Clips circulating under that name use unrelated storm footage, laboratory experiments or computer animation. This dossier stores the open-licensed laser record instead. We will not replace a missing witness with a more cinematic false one.
Liv Haldorsen · offshore structures group · review note 7Archive reconstruction. A clearly marked fictional research layer of Code Gaia.The first question in the room was whether the laser had failed.
That is the correct first question. Instruments produce monsters more often than oceans do.
But a failed sensor must explain the shape before the peak, the descent after it, the neighbouring measurements and the damage above the expected reach of the sea. An error that agrees with independent evidence is no longer easy to call an error.
We had spent decades asking whether sailors exaggerated. The trace forced a less comfortable question: which part of our design practice had been built around the assumption that they did?
It did not create the idea of rogue waves. It changed the burden of proof.
Ships had reported isolated walls and holes in the ocean for generations. Some earlier instrumental records also contained unusual waves. The scientific problem was not total disbelief. It was the scarcity, quality and accessibility of evidence. Extreme events are rare, instruments are usually elsewhere, and a single impossible-looking spike can be blamed on malfunction.
Draupner supplied an unusually clean in-situ record. After 1995, the useful question was no longer whether such waves could exist. It became how often they occur, which mechanisms produce them and whether ships can receive meaningful warning.
Three mechanisms can lead toward the same wall
“Rogue wave” names the result, not one universal cause. Different seas may concentrate energy in different ways.
Linear focusing
Wave components with different periods and directions can briefly align. Their elevations add at one location and then separate.
Current focusing
Waves travelling against a strong current can shorten, steepen and bunch together. Geography can make some regions more dangerous.
Nonlinear transfer
Under some conditions, energy moves within a wave group and feeds an exceptional crest. How important this is in real directional seas remains debated.
A high-resolution reconstruction of the Draupner storm found a complex crossing sea near the time of the event. In 2018, researchers recreated the full scaled crest in a circular laboratory tank only when two wave systems crossed at a large angle. Instead of simply spilling forward, the crest formed a near-vertical jet. The experiment showed that directional crossing can support a wave with Draupner’s shape. It did not prove that this was the only process operating in the North Sea that day.
Dr Amara Voss · directional wave basin · run 31Archive reconstruction. A clearly marked fictional research layer of Code Gaia.A model can fail without making a numerical mistake.
Give the sea one preferred direction and the crest breaks too early. Allow another wave system to cross it at a large angle and the same energy finds a vertical route.
The disturbing part is not that the ocean broke a law. It followed dimensions the simplified model had discarded.
When a rare event appears impossible, inspect the assumptions that made the world smaller before inspecting the world.
Can the next one be predicted?
Forecast systems can identify regions where wind, currents and crossing seas increase the risk of extreme waves. Radar and stereo-camera systems can also reconstruct the nearby sea surface. Neither approach turns a rogue wave into a conventional storm warning.
The practical timescale is cruel. A ship may need to recognise a dangerous crest within seconds or minutes, while the event is forming inside a chaotic field. Statistical forecasts can say that conditions are favourable. They cannot yet identify every future Draupner and place a reliable countdown beside it.
What is established—and what remains open
| Status | Finding | Basis |
|---|---|---|
| Confirmed | An exceptional wave struck the Draupner platform on 1 January 1995 | The downward-looking laser recorded a coherent surface-elevation trace supported by other platform evidence. |
| Confirmed | The wave was 25.6 m from trough to crest | The crest reached 18.5 m above mean sea level in a sea state with significant height close to 12 m. |
| Confirmed | Large crossing angles can reproduce a Draupner-like crest in the laboratory | A circular-basin experiment recreated the scaled height and profile under crossing-wave conditions. |
| Unresolved | The exact contribution of each formation mechanism | Directional focusing, currents and nonlinear effects can interact; one event does not isolate them. |
| Unresolved | Reliable short-term warning for an individual rogue wave | Risk conditions can be forecast, but deterministic warning remains limited. |
| False | A surviving video shows the 1995 wave | No authenticated camera or acoustic recording of the event is known. |
The honest verdict
Draupner did not prove that every lost ship met a rogue wave. It did not reveal a single equation that predicts them all. It established something narrower and more consequential: an ocean wave can rise far outside the surrounding sea state, strike modern infrastructure and vanish within a record only a few minutes long.
The measurement converted an old maritime warning into an engineering requirement. But it left the most useful question open: what signal exists before the height becomes obvious?
The largest waterfall on Earth is hidden beneath the ocean
CG-051 · OCEAN & DEEP SYSTEMSA ship can cross it without seeing itBetween Greenland and Iceland, dense water descends more than three kilometres into the deep Atlantic at roughly three million cubic metres per second.
Open CG-051 →If an exceptional wave can escape notice until a laser meets it, what planetary-scale movements remain hidden because the ocean surface looks ordinary?